01Provenance

The tool that drew this website

Start with the confession: the site you are reading is drawn in this tool's aesthetic. The contour hero, the survey plates, the sheet marks in the footer, the elevation ticks running down the project cards. All of it traces back to an app I built to answer a simpler question: can a browser turn raw noise into something that looks surveyed?

Topographic Generator does exactly that. Feed it a seeded noise field or a photo and it draws contour lines on a canvas, live, the way a USGS quadrangle draws elevation. No map data is involved. The terrain is invented; the drawing conventions are borrowed from a century of survey sheets.

It stays deliberately small. Past React itself, the runtime depends on exactly three libraries: d3-contour to trace the lines, simplex-noise to invent the terrain, and gifenc to write animated GIFs. Roughly 2,423 lines of JavaScript and 963 lines of plain CSS cover everything else. No CSS framework, no state library, no chart package.

02Source data

Two inputs, one height field

Everything the app draws begins as the same structure: a flat grid of heights between 0 and 1. Two unrelated sources produce it, and nothing downstream knows which one did.

Noise or photo becomes Height field · 0-1 feeds d3-contour through ringPath() renders to Canvas + SVG

Input A · Procedural noise

Simplex noise stacked into fractal Brownian motion. Scale sets how many features fit across the shorter edge, and octaves (1-8), roughness, and lacunarity shape the detail. Domain warp runs a second noise instance that bends the sampling coordinates, which is what gives contours their hand-drawn wander, and a ridged toggle folds the signal into sharp ridgelines.

Seeds are the contract. simplex-noise v4 dropped integer seeding, so a custom mulberry32 PRNG restores it: seed 4127 draws the same terrain on every machine, every time. Generators are cached per seed, because rebuilding permutation tables on every frame would sink the animation loop.
Input B · Uploaded photo

createImageBitmap decodes the file with EXIF orientation honored, so phone photos land right side up. The bitmap downscales to a 480 px max edge to keep d3-contour cost bounded, then reduces to luminance (0.3R + 0.59G + 0.11B). Blur, contrast, brightness, and invert shape the field from there. Faces, mountains, and coffee mugs all become elevation.

The field caches against a signature of the image plus its settings and rebuilds only when one of them changes. Restyle the lines all day; the luminance grid never recomputes.

Survey noteBoth inputs emit one structure: a flat Float64Array of 0-1 heights. Every styling, animation, and export feature works on either source, because none of them can tell the difference.

03Geometry

One emitter, two identical outputs

d3-contour traces the field at 2 to 60 evenly spaced thresholds (14 by default), kept strictly inside the field's min and max so no ring collapses at the border. A threshold-shift control slides every level by up to half a step and wraps around, which is the entire mechanism behind the threshold-scroll animation.

Each ring then earns its shape. Radial-distance decimation drops points the eye can't see (and cuts SVG weight), and a Catmull-Rom pass converts what survives into cubic Bézier curves, with tension driven by a 0-1 smoothing slider. At zero you get the raw polygon; at one, contours that look inked.

The decision I'd defend in any review: one emitter. ringPath() either writes each ring into a canvas Path2D or returns an SVG path string with 1-decimal rounding. Same function, two sinks. The SVG you download is not a reconstruction of the preview. It is the preview.

Sizing follows the same discipline. Stroke widths, dash lengths, and simplify tolerance all normalize against a shorterEdge/600 reference, so a 4096 px export and the on-screen canvas are the same drawing at different scales, never a thicker or thinner copy.

Field method · one geometry, two sinks

ringPath()

writes toPath2Dcanvas preview

returnsd stringSVG export

Because both sinks share the emitter, the vector can never drift from the raster. There is no second drawing implementation to keep in sync.

04Cartography

Styled like a quadrangle, not a chart

Contour lines carry a hundred-year-old visual grammar. The styling controls chase that grammar instead of generic plot options.

  • Index contours

    Every Nth line (every 5th by default) draws heavier and darker, with its own width multiplier and color shift. It's the convention that makes real topo maps legible at a glance.

  • Fill modes

    Lines, filled bands, or both. Bands paint low to high with an evenodd rule plus a base band underneath, so valleys never open holes to the background. Band opacity gets its own slider.

  • Line character

    Widths from 0.25 to 8. Solid, dashed, or dotted, where a dot is a 0.01-length dash with a round cap. Cap and join controls, plus an optional taper that draws higher elevations heavier.

  • 32 palettes

    Each palette defines a background plus 1-5 elevation-mapped line stops: Blueprint, USGS Quad, Cyberpunk, Vaporwave, and 28 more. Or go manual with a single color or a 2-stop elevation gradient.

  • Masks

    A rectangle or circle mask with an adjustable inset frames the field, over a background color or full transparency.

  • Rotation with overscan

    Rotating the field over-renders it by |cos| + |sin| of the angle (a full square root of 2 while the rotate animation runs), so the corners never show blank paper.

05Motion

Six ways to make terrain move

Loop durations run 1 to 120 seconds, a mode starts playing the moment you pick it, and Space pauses. Only morph and drift ever pay to rebuild the terrain; the other modes restyle a cached height field each frame.

  • none
  • morph · 4D loop
  • drift · 3D scroll
  • threshold scroll
  • rotate
  • pulse width
Field method · a loop with no seam

zc = r · cos(2πt)

wc = r · sin(2πt)

Morph samples 4D noise around a circle in the zw-plane, with the radius set by morph depth. When t completes the circle, the sample point is back where it began, so the last frame of a loop flows into the first with no visible cut. That one equation is why the GIFs loop forever without a stutter.

06Exports

Five formats out of one pipeline

The export modal offers exactly five formats: PNG, JPG, WebP, SVG, and animated GIF. All five run the same field-to-contours pipeline; only the sink changes.

PNG / JPG / WebPraster
Rendered to an offscreen canvas at a chosen export size (long edge 256-4096, default 1600) on a separate export-detail grid of up to 600, then written with canvas.toBlob. JPG and WebP take a quality slider (0.5-1, default 0.92), and JPG forces an opaque background because the format has no alpha.
SVGvector
buildSVG() serializes the document by hand: one path per contour, a clipPath for the mask, a transform group for rotation. Same field, same rings, same emitter, so the file matches the on-screen preview stroke for stroke.
Animated GIFmotion
Encoded in the browser with gifenc. Each frame renders at t = i/frames (no minus one, so periodic modes loop cleanly), gets quantized to a 256-color palette, and carries a delay of 100 · duration / frames centiseconds, so the file plays back at the preview's loop length. FPS runs 6-30 with a 160-frame cap, and a zero-delay await between frames keeps the UI responsive and the progress bar honest.
Format guardsall formats
Transparency auto-disables for JPG and GIF (GIF alpha is unusable), and the app warns when filled bands would cover a transparent background anyway. Every file downloads as topographic-{palette}-{seed}-{timestamp} through an object URL and a programmatic click.

Honest marginsGIF encoding runs inside a browser tab, not on a render farm, so it trades ceiling for speed: the grid caps at 260 and the output at 240-800 px. When you want wall-print resolution, that's what the 4096 px PNG and the SVG are for.

07Control deck

46 parameters that feel like six

A tool with this many knobs lives or dies on its control system. Most of the engineering here is invisible on purpose.

  • Registry-driven UI

    PARAM_REGISTRY is the single source of truth: all 46 parameters in 11 groups, each declaring its control type, default, randomize bounds, and share-URL behavior. The sidebar, the defaults, the randomizer, and the URL codec all read the same object. Adding a knob is one entry, not five edits.

  • Shareable URLs

    Settings are diffed against defaults, serialized to JSON, and carried as base64 in the URL hash. A link is the artwork: send it, and the recipient opens your exact state.

  • Undo that respects sliders

    A 30-entry history where slider drags stage uncommitted values and commit on release. Scrubbing a slider is one undo step, not forty.

  • Presets and randomize

    30 hand-picked presets (Blueprint, Bathymetric, USGS Quad, Ink Wash) plus a randomizer that rolls every parameter inside per-parameter safe ranges, weighted where taste matters: fill mode leans toward lines.

  • Preview decoupled from export

    The live preview renders on its own detail grid (default 180), with device pixel ratio capped at 2, the long edge capped at 1500 px, and settings changes debounced at 80 ms. Export detail is a separate decision, so on-screen speed never limits file quality.

  • The quiet cache layer

    Noise generators cache per seed, image fields cache by settings signature, and the height field carries across frames for every animation mode that doesn't morph the terrain. The render loop only pays for what actually changed.

Aspect ratios from fill-screen to 9:16, drag-and-drop photo upload, and a dark/light theme persisted to localStorage round out the deck. State lives in React Context behind a single reducer.

  • CtrlZ / Yundo / redo
  • Rrandomize
  • Eexport
  • Spaceplay / pause

Stack

  • React 18
  • Vite 5
  • d3-contour
  • simplex-noise
  • gifenc
  • Plain CSS · no framework

By the numbers

  • 46 parameters in the registry
  • 32 built-in palettes
  • 30 hand-picked presets
  • 5 export formats
  • 3 runtime dependencies

08Plates

Survey plates

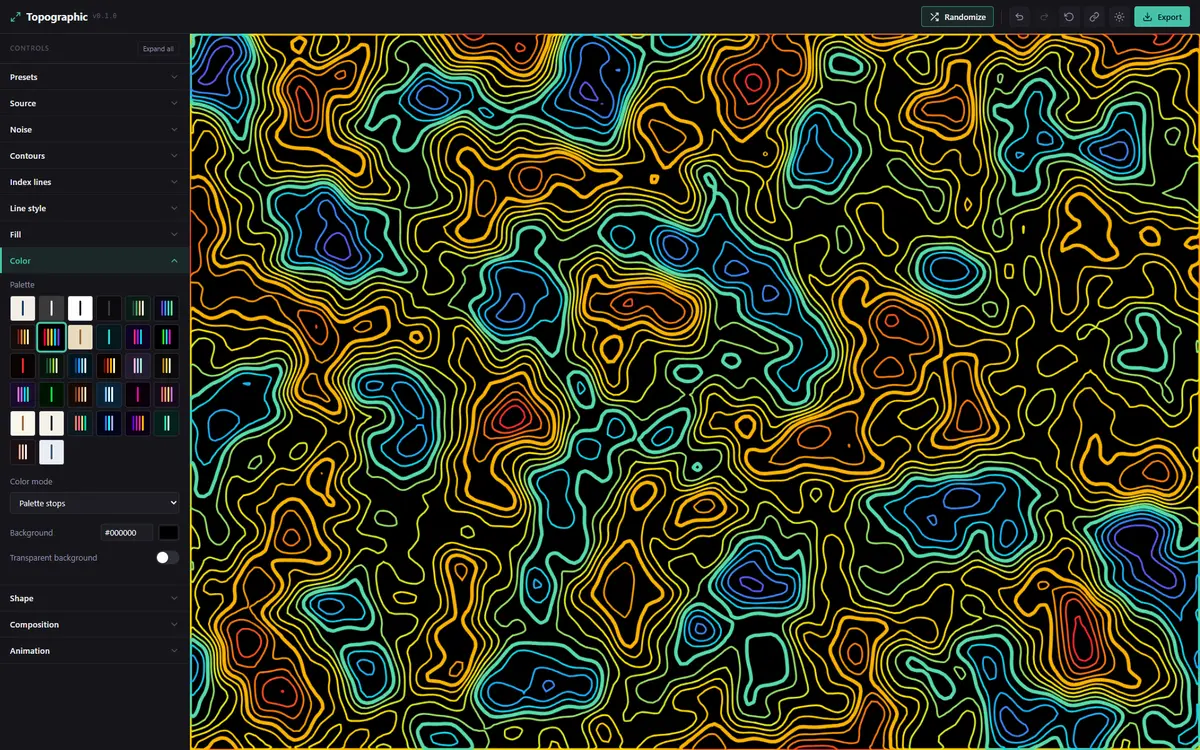
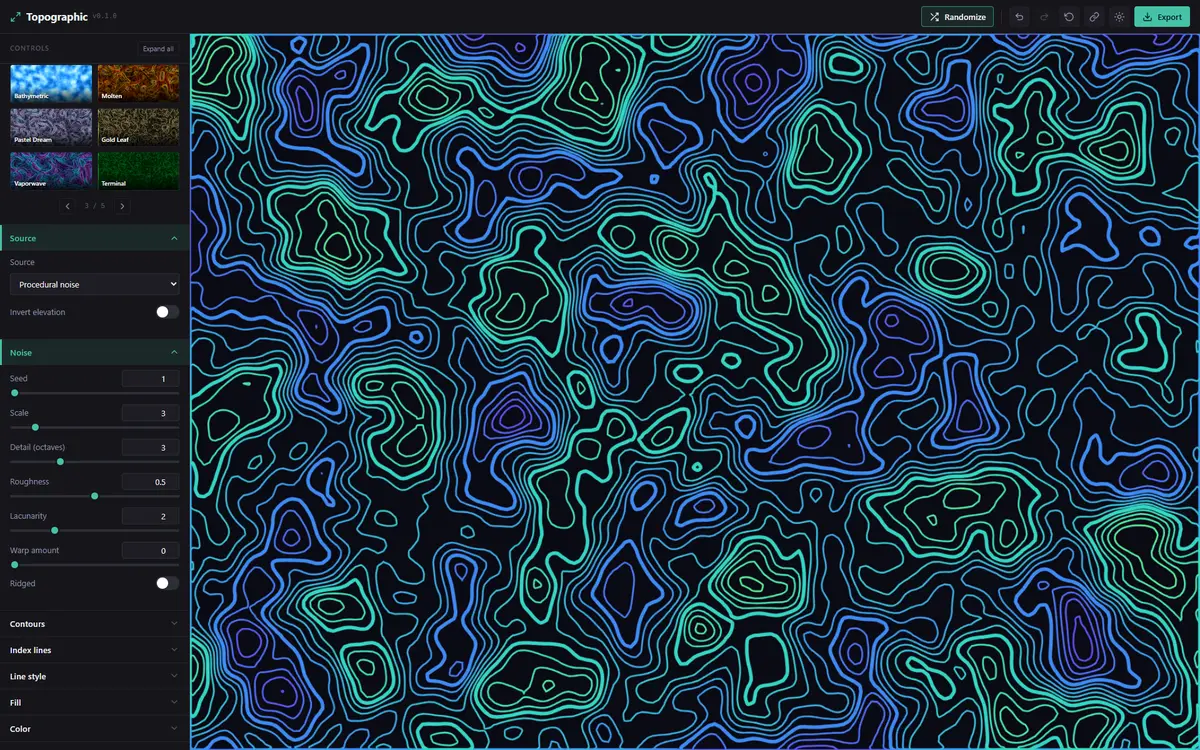
Six plates from the live tool: the workbench mid-survey, the preset strip, and four exports straight out of it.

The Topographic workbench: palette swatches and color controls beside a live canvas of rainbow contour lines on black
Plate 01 · Work area · grouped sidebar controls + live canvas
The Topographic preset strip: thumbnail previews like Bathymetric and Molten above source and noise controls, an Aurora contour field on the canvas
Plate 02 · Preset strip · one-click looks, source and noise controls
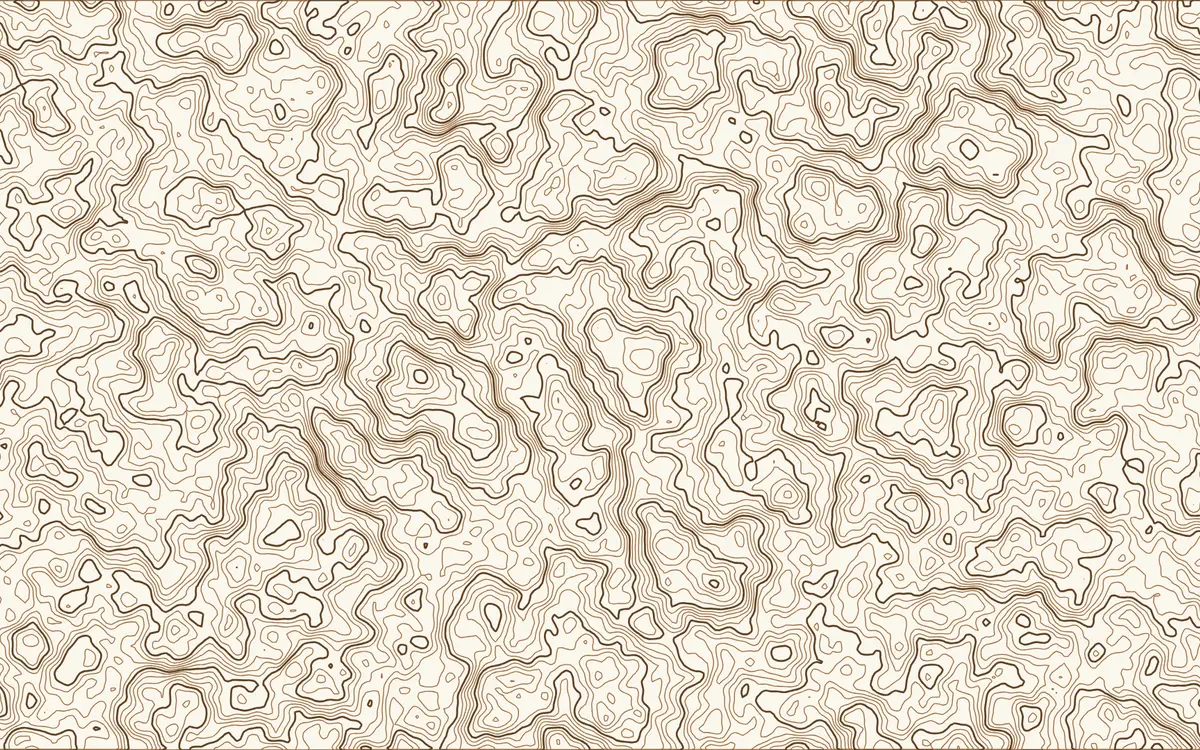
An exported contour field in the USGS preset: brown quad-sheet linework on cream
Plate 03 · Export · USGS preset, the quad-sheet look this site borrows
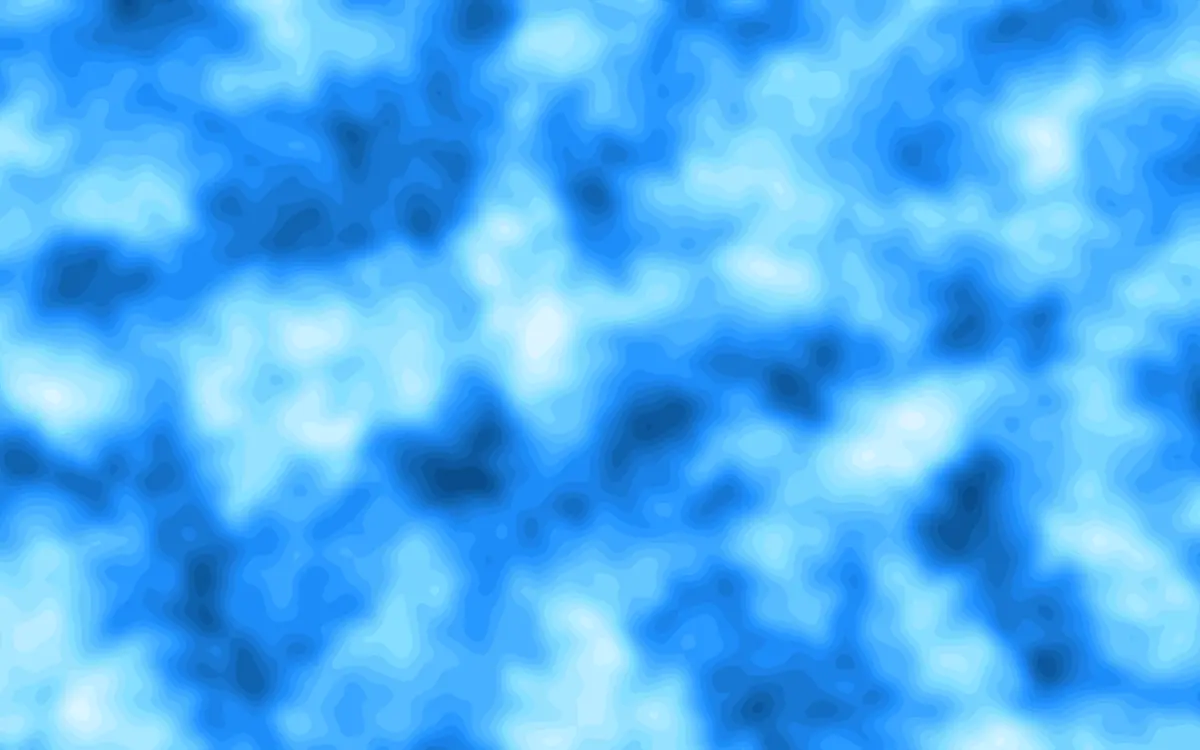
An exported contour field in the Bathymetric preset: filled depth bands in ocean blues
Plate 04 · Export · Bathymetric preset, filled bands instead of lines
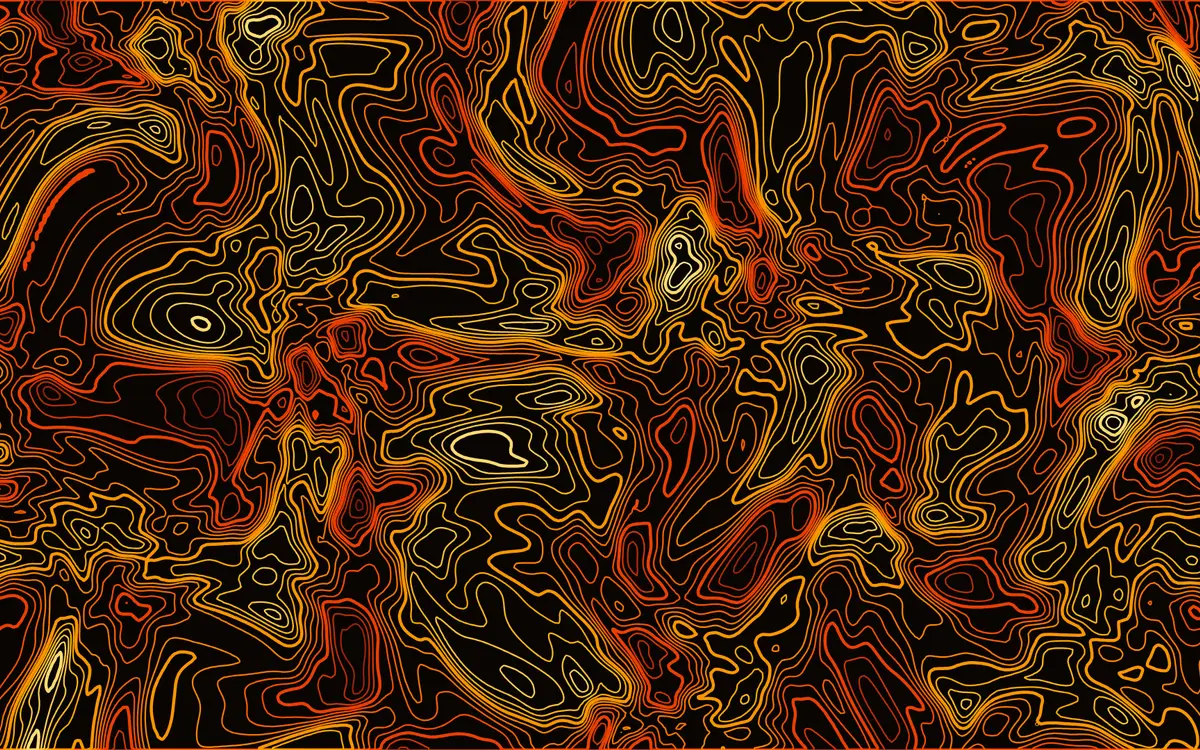
An exported contour field in the Molten preset: orange and gold contour lines glowing on black
Plate 05 · Export · Molten preset, the same noise running hot
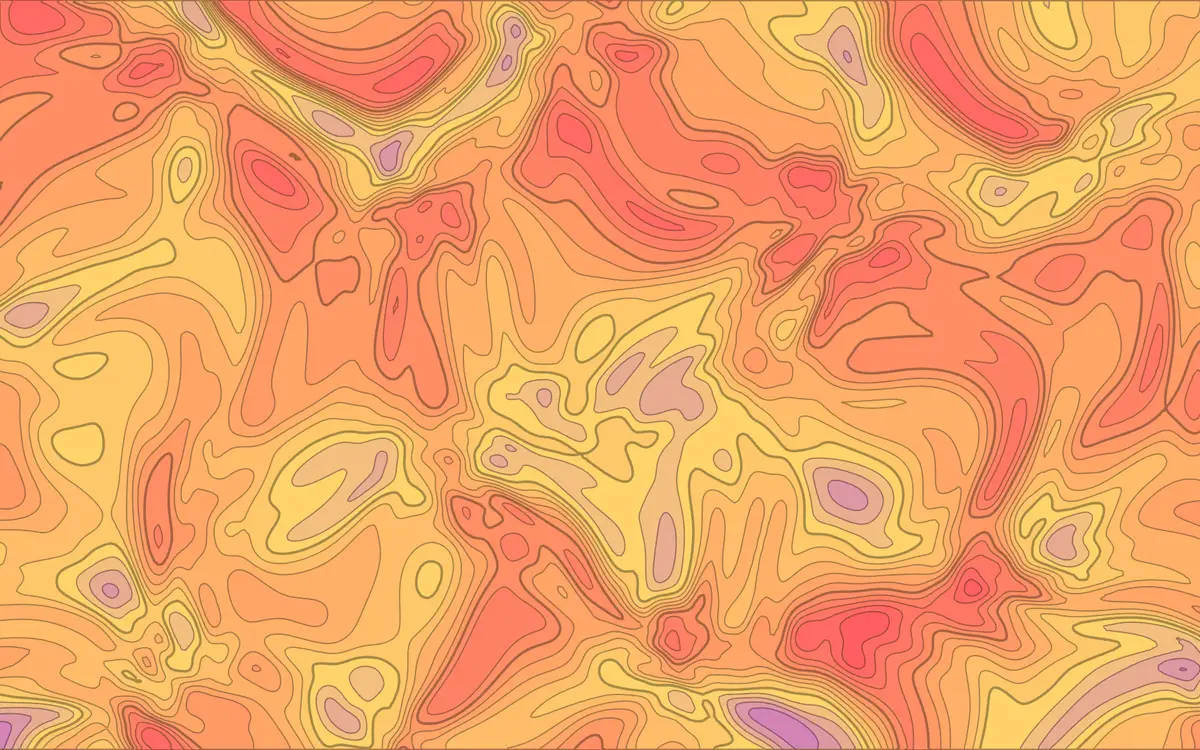
An exported contour field in the Sunset preset: filled bands of orange, coral, and gold
Plate 06 · Export · Sunset preset, filled bands running warm

09Transmission

Need tooling this exact in the browser?

Canvas render pipelines, real vector export, generative graphics, interfaces that keep 46 controls feeling calm. This is the frontend work I reach for first, and the same discipline that keeps a GIF loop honest keeps product UI honest. I work from the Chicago area, on site or remote. Tell me what you want to draw.